Table of Contents
The past decade has been a weird one for motorists. With the emissions era seemingly long behind us and modern chassis and tire tech far surpassing what was possible when the interstate system was first envisioned, state governments have taken it upon themselves to push for higher speed limits for limited-access highways. Meanwhile, modern urbanists have championed road diets and reduced limits in cities, towns and their surrounding suburbs. But whatever the results of individual projects may be, it’s difficult to measure the broader efficacy of these initiatives without years of hard data. Enter AAA.
Over the past five years (with 2020 excluded as an outlier due to the pandemic), AAA conducted a study of several speed limit adjustment projects nationwide. The study included cases of speed limits being raised and lowered, and looked at projects based on roadways in four major categories — interstate highways, principal arteries, minor arteries and collectors — from all over the USA. While your local project may not have made the list, chances are there’s something comparable in the mix. Let’s take a look at some of the key takeaways.
Raising speed limits may lead to more fatal accidents
While fatalities increased on three of the roads where limits were raised, they fell on two others; a sixth showed no change. Two of the cases studied with increased fatalities were I-70 and I-95; I-84 saw a decline during the same period. While the combined total of fatalities between the three interstates increased, it was not to a statistically significant degree, AAA said. The deviations in fatalities across all three interstates were small (single digits). Those tight variances point to a small sample population; a longer-term study would likely be able to provide more definitive analysis.
Moving away from interstates, the data get even more murky. Fatalities increased or decreased by only low-single-digit amounts on surface streets. In two cases, they increased. In two others, they went down. The remaining two showed no records for either the study period or control period. AAA also provided data for accidents resulting in non-fatal injuries or property damage only. Their trends followed those of fatal accidents, lending credibility to those figures despite the smaller sample population.
Changing the limit doesn’t necessarily change drivers’ speeds
Conventional wisdom might dictate that higher speed limits result in higher speeds. While that’s generally true, AAA found that drivers on interstates where limits were raised don’t necessarily go hog-wild with their newfound freedom. On three interstates where the limit was increased by 5 mph (I-70 in Maryland, I-95 in Maine and I-84 in Oregon), 85th-percentile speed increases were less than 3 mph. I-84 in Oregon showed the largest mean speed increase — 4 mph — but even there, 85th percentile speeds only increased by 2.8 mph. AAA says the change made no statistically significant impact on travel times over any of the three routes, nor was there an appreciable change in traffic volume attributable to the higher speed limit.
This also held true on arterial roads. A 5 mph increase on TX-289 (Preston Rd) resulted in an 85th percentile speed increase of just 2.1 mph. An identical change on Victory and Obama Boulevards in California resulted in an 85th percentile speed increase of 2.4 and 1.6 mph, respectively. In all three cases, AAA saw compelling evidence of reduced travel times.
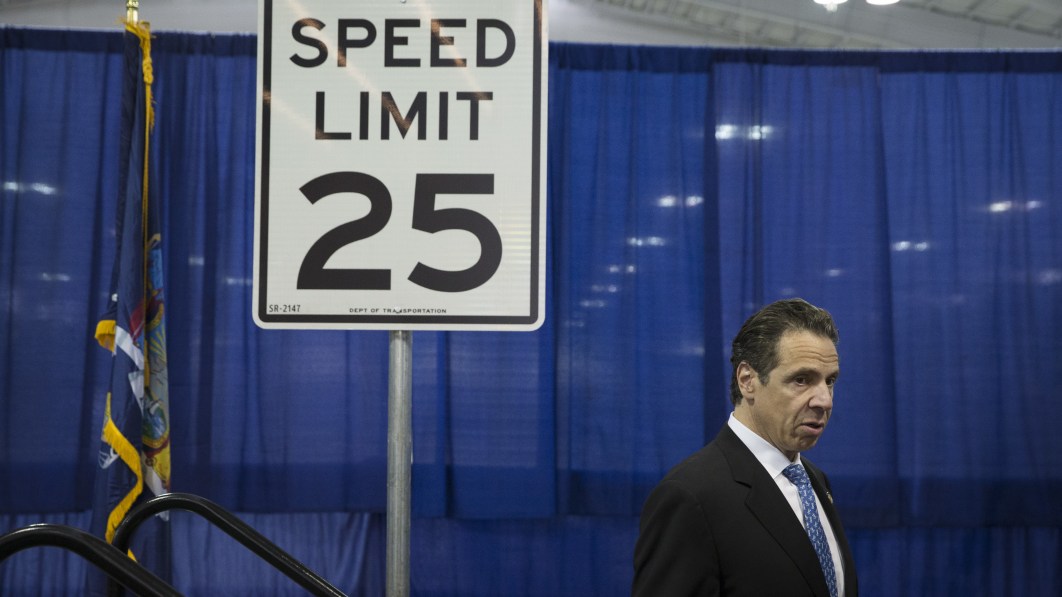
And what about cases where speed limits were reduced? AAA wasn’t able to study any interstates with reduced speed limits during the window of this study, but six arterial and collector roads were examined, five of which had their limits reduced by 5 mph. The sixth — a stretch of Southwest Capitol Highway in Oregon — was reduced by 10 mph. In only three of these cases did the observed mean or 85th percentile speed of drivers decrease: Division Street in Oregon saw an 85th percentile drop of 2.2 mph despite the mean speed of all drivers increasing by 0.8 mph. Northeast Marine Drive (also in Oregon) saw an 85th percentile drop of 1.5 mph against a mean decrease of 0.3 mph, while 85th percentile speeds on Southwest Capitol Highway increased by 0.4 mph against an average drop of 1.5 mph — and that’s on a street where the speed limit was reduced from 35 mph to 25.
But before you grab your pitchfork and go after City Hall for dragging down your local speed limit, would you care to guess how many of those changes caused an increase in travel times? Yeah, the number’s zero. Driving 25 mph in the city might suck, but as it turns out, it’s not actually holding anybody back. Total traffic volume was unaffected, AAA says.
Raising speed limits reduces speeding infractions
Of the conclusions suggested by AAA’s study, the most compelling was its analysis of speeding infractions. In every case where the speed limit was raised, speeding infractions declined. In the five cases where data was provided for roads whose limits were reduced, those infractions became more widespread. And unlike the fatality data we discussed above, AAA says the infraction trends were statistically significant. The increase in ticketing was especially pronounced immediately after the speed limit was reduced, which makes sense, as many drivers used to their routines were likely caught unaware by the change. Taken with the above, this suggests that drivers tend to choose their speed based on their comfort level on a given stretch of road, rather than blindly adhering to posted speed limits.


